Platform
From store report to management action.
The platform is built around one loop: capture what happened, diagnose it with performance data, recommend the next action, and track whether it was done.
- 86+
- stores live
- 5.5k+
- reports completed
- 7.9k+
- insights generated
- 687
- tasks created
Ask plain-English questions across every connected surface: KPI data, EOD reports, store visits, products, floorplans, stock, tasks, customers, and report history.
- Answers questions across stores, states, categories, products, and dates
- Drills from national performance to store, section, and product-level causes
- Uses qualitative EOD and store-visit evidence alongside quantitative data
- Returns recommended actions with enough source context to trust the answer
- Supports report creation, investigation, and follow-up from one chat surface
Ask AI
Why were sales down last week?
Answer
NSW and VIC caused the miss.
Drilldown
Recommended action
Rebuild front-table story, then transfer Oxford Shirt Ivory only if donor-store cover remains healthy.
A daily trading cockpit for retail leaders. Use Trend Explorer, KPI tables, product demand and exports to understand sales, budget, LY movement, traffic, conversion, ATV, IPT and online share.
- Trend Explorer for state, store, channel and date-window investigation
- KPI tables with sales, budget, LY, traffic, conversion, ATV and IPT
- Top product demand views with retail/online channel filtering
- Downloadable datasets for weekly trading reviews
- Designed to move from headline performance to the exact driver quickly
Trend Explorer
Sales, traffic and conversion in one read.
Sales
$2.08m
+8.1%
Traffic
44.6k
-2.4%
ATV
$298
+6.8%
IPT
1.9
+0.2
Scheduled and manual reports are generated, stored and reviewed inside the app. Teams can open published briefings, view attachments, filter by report type or title, and ask AI follow-up questions from the same evidence.
- Manual KPI, category, heat map and AI report generation
- Scheduled weekly KPI, online, money mapping, store summary and custom briefings
- Inbox with reports, completed submissions, attachments and briefing history
- Recipient, store, report type, title, status and date filtering
- Run-now controls and in-app report review before forwarding externally
Scheduled reports
National KPI
Sun 9:30Workbook + briefing
Money Mapping
Sun 9:35PDF + section data
Store Summary
Sun 9:45Top 5 PDFs
Online KPI
Sun 9:50Online workbook
Generated pack
Email summary
Extended briefing
Excel workbook
PDF attachment
Delivered to inbox with Ask AI context.
Users can open the report, see the attachments, then ask follow-up questions against the same evidence.
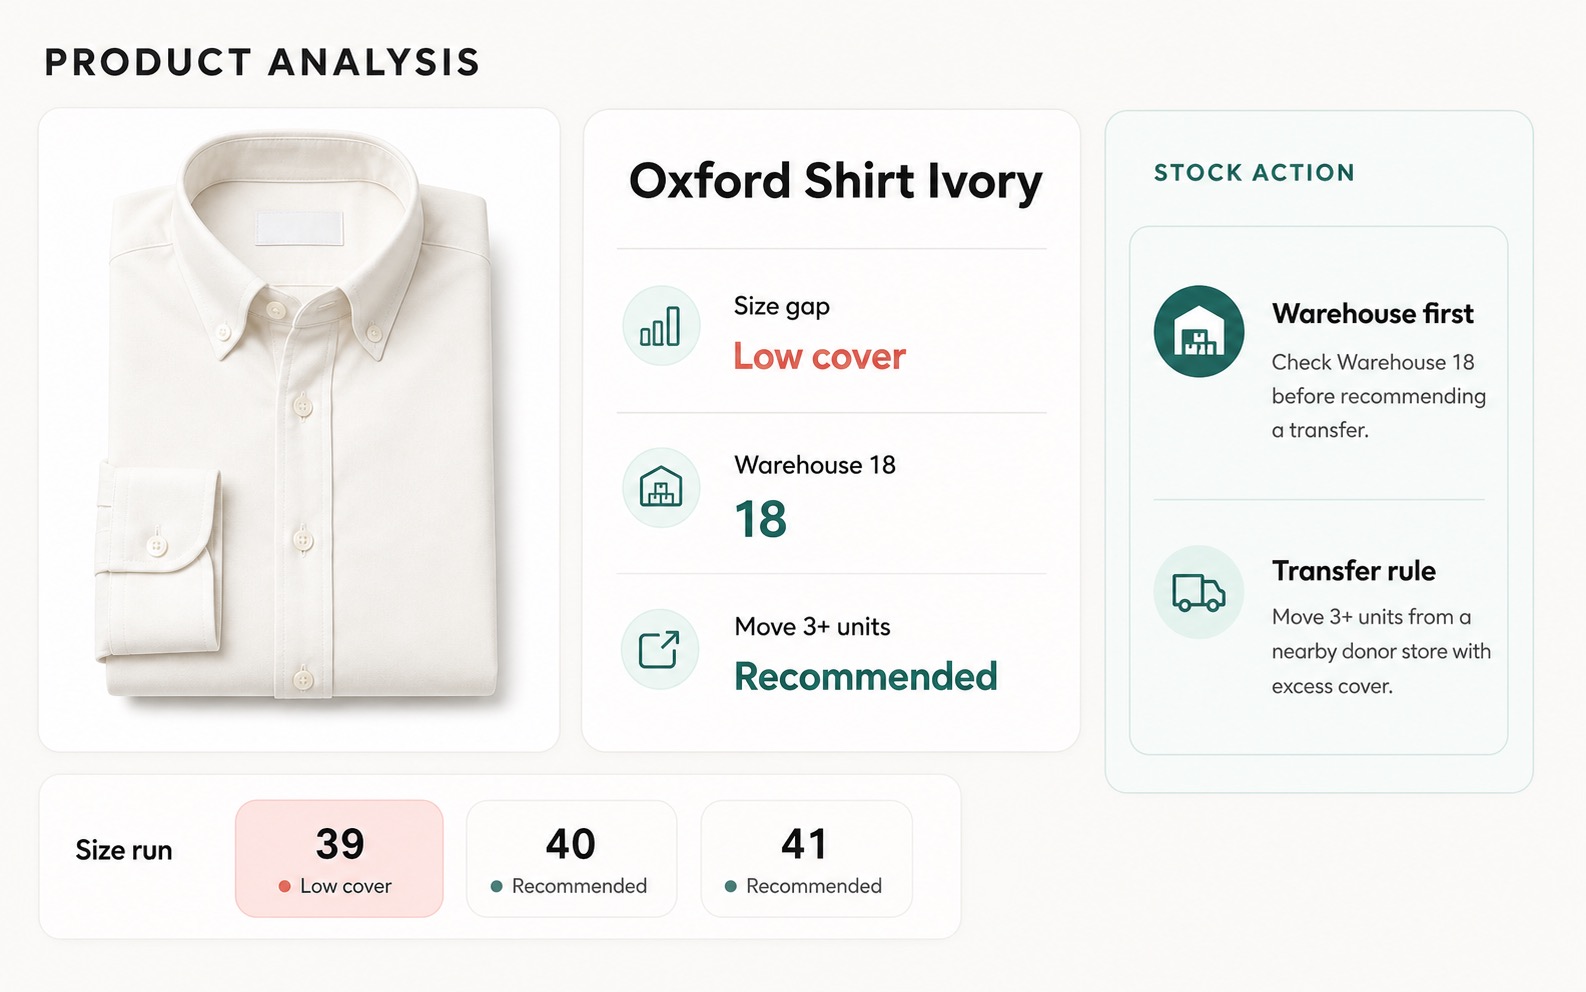
A product workspace for retail and buying teams. See product cards, size availability, weeks cover, sell-through, future purchase orders, floorplan placement, and stock decisions together.
- Product cards with image, sales, units, price status, weeks cover, and stock
- Size-run and fragmentation analysis by style, colour, store, and section
- Buying and transfer recommendations tied to recent demand and current cover
- Floorplan context showing whether a product is on floor, off floor, or duplicated
- Shared evidence for retail, merchandising, and buying decisions
Buying queue
Product evidence becomes a decision.
Size curve
Sold vs stock
A connected buying workflow for planning scenarios, loading workbook inputs, applying buyer rules, reviewing evidence, approving recommendations and exporting the final pack.
- Range board grouped by launch month, drop week, story, department, role and decision
- Scenario planning with options, units, revenue, intake cost and intent coverage
- Buy Engine workflow for plan, product validation, buyer rules, evidence and recommendations
- Assistant panel for asking questions about a buy plan or selected line
- Approval and export pack flow for handing off decisions
Range board
Tailored
48 options
Shirts
72 options
Knitwear
36 options
Outerwear
24 options
Buy engine
Plan
Scenario and OTB
Products
Workbook inputs
Buyer rules
Coverage and phasing
Recommend
Model output
Review
Approve and export
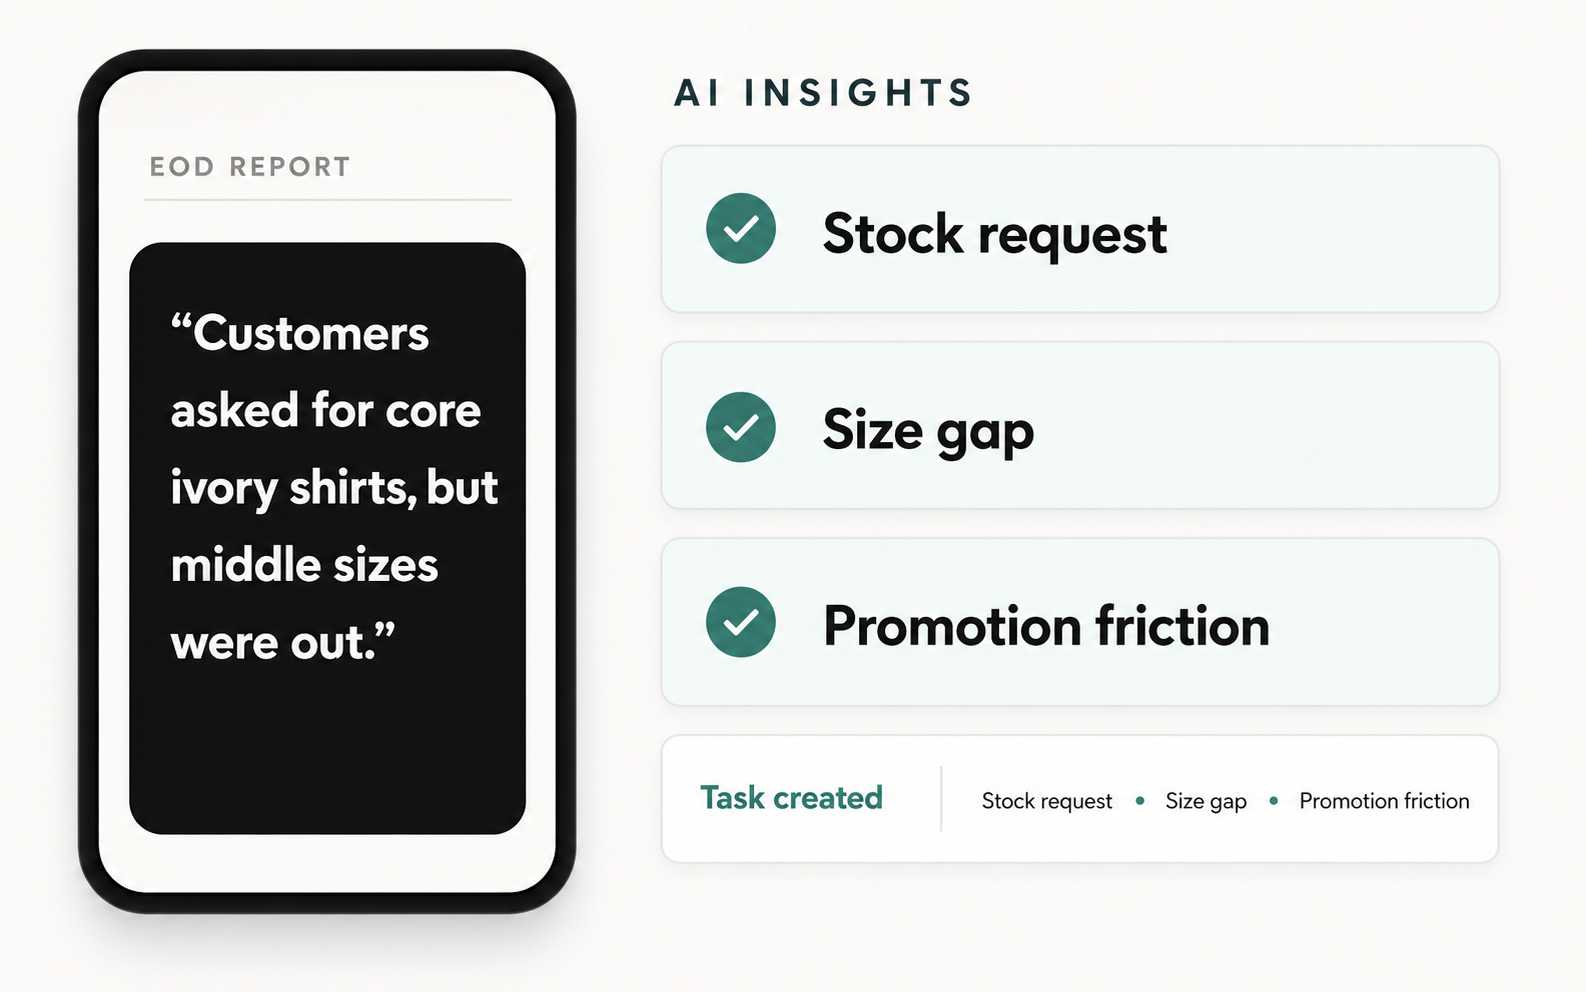
Capture daily qualitative observations from every store, then combine them with KPI and stock context so leadership can see what changed and what needs action.
- Custom question templates with rotation and grouping
- Text, score, boolean, currency, and percentage question types
- AI extracts categorized insights and clusters repeated themes
- Daily and weekly digests with supporting evidence and links back to source reports
- Manager replies captured and shown to staff as next-day context
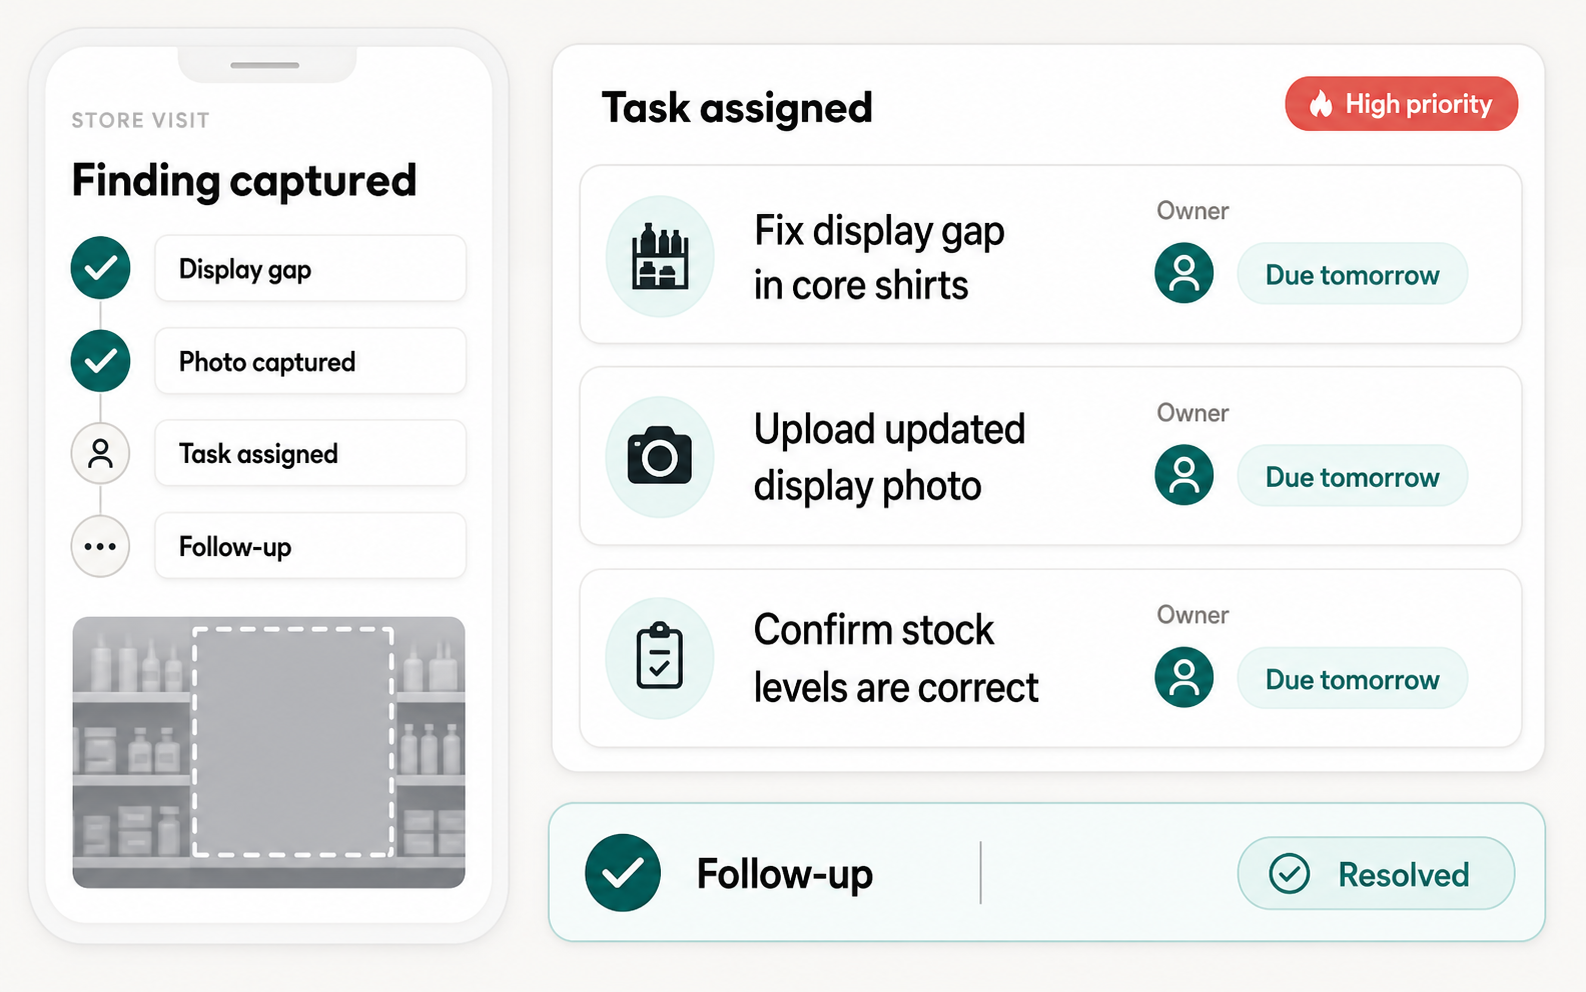
Structured field audits for regional managers. Complete scored checklists during store visits, then turn observations into prioritized follow-up tasks with owners, due dates, and evidence.
- Scored questionnaires with custom templates
- AI-suggested follow-up tasks with High / Medium / Low priority
- Resolution tracking with email notifications and in-app inbox visibility
- Photo evidence attached to task completion
- Visit analytics: coverage gaps, performance trends, score benchmarks
A coaching surface for sales teams. Rank performance, see category strengths and gaps, and open a salesperson-level detail view with sales, ATV, IPT, daily trend and store context.
- Sales per hour leaderboard using estimated active selling windows
- ATV, IPT, total sales, stores worked and rank comparisons
- Category strengths and coaching opportunities by salesperson
- Filters by state, territory, channel segment and store
- Drilldown sheets for individual performance context
Staff leaderboard
A. Peterson
Tailoring +18ppt
J. Fisher
Shirts +12ppt
P. Bosnet
ATV +9%
R. Chen
UPT +0.4
Coaching gap
Staff insight becomes coaching, not blame.
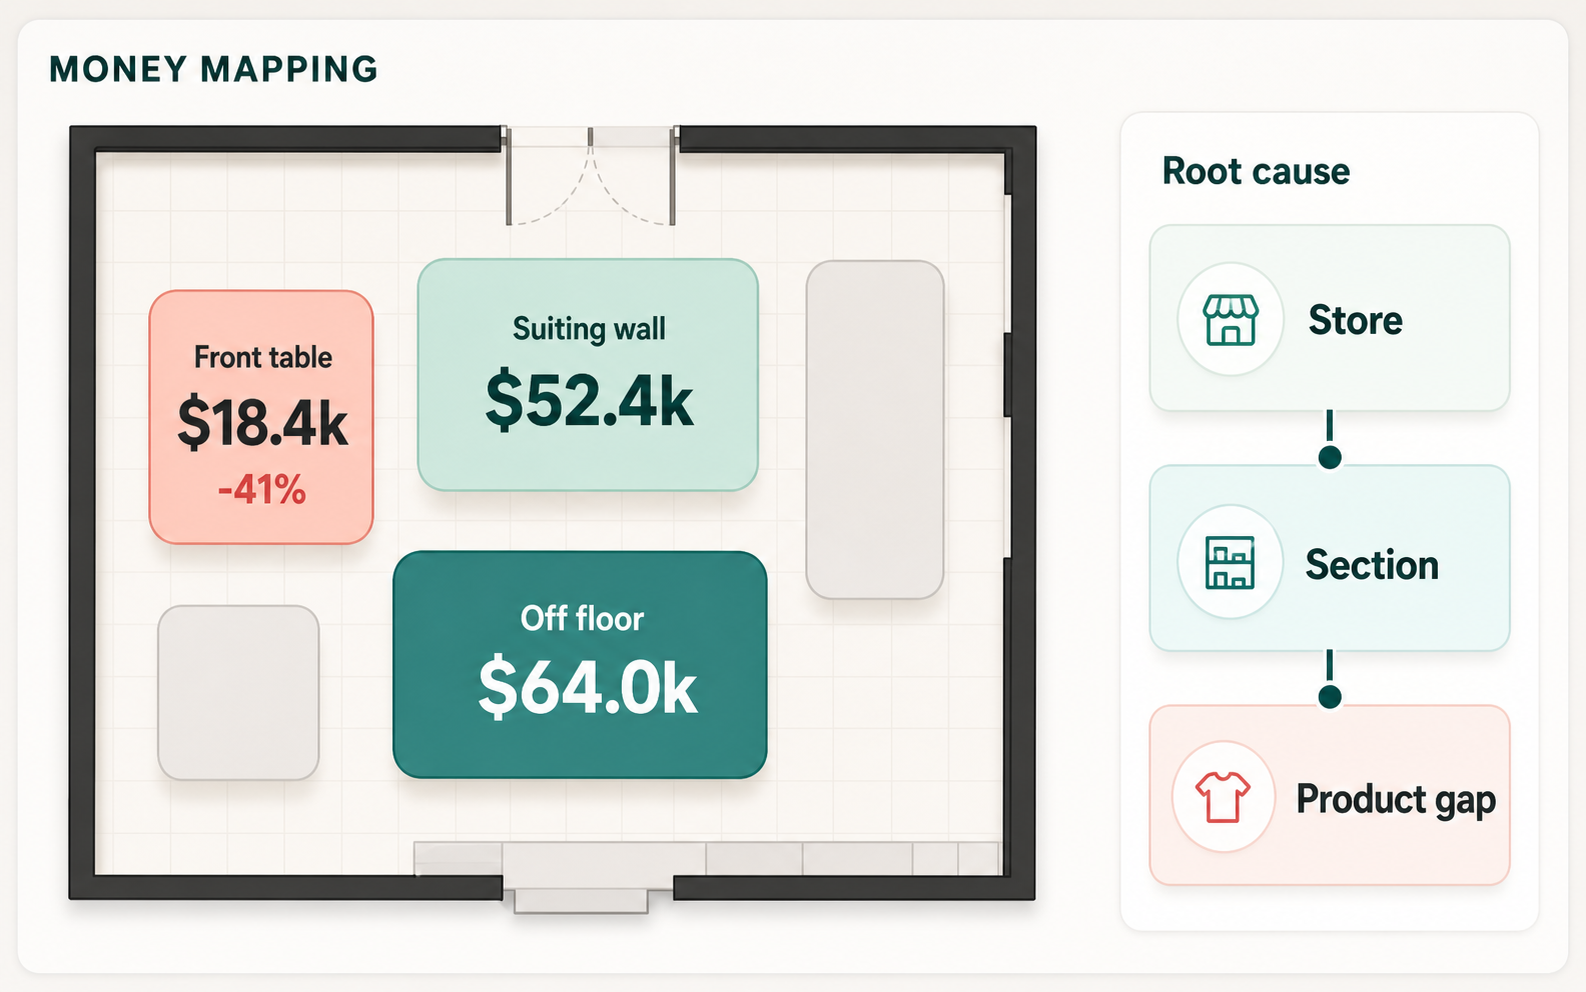
Upload your store floorplan, draw sections on a visual canvas, and scan products in with barcodes. Campora AI overlays performance data so teams can see which zones drive revenue, which products are off floor, and which sections need action.
- Visual editor with rectangle and circle sections on uploaded images
- Barcode scanning for product-to-section assignment
- 8 overlay modes: sales, units, share %, budget, heatmaps
- Section-level performance ratings, off-floor reconciliation, and peer benchmarking
- Draft/publish versioning with barcode label persistence
A tap-to-ask assistant for customers in store. They can ask where products are, what is on sale, what fits their budget, or where a section sits on the floorplan.
- QR/NFC tap entry point for customer-facing product discovery
- Answers questions about categories, colours, prices, sale items and locations
- Shows product cards when a question is product-specific
- Highlights sections on the floorplan when location matters
- Keeps the customer experience simple while using the store's live product context
Customer asks
Do you have navy suits under $700?
3 options found
Tap to see on floorplan
Storefront answer
Product discovery without waiting for staff.
Saunders Slim
Macy Tailored
Guyra Regular
Oxford Shirt
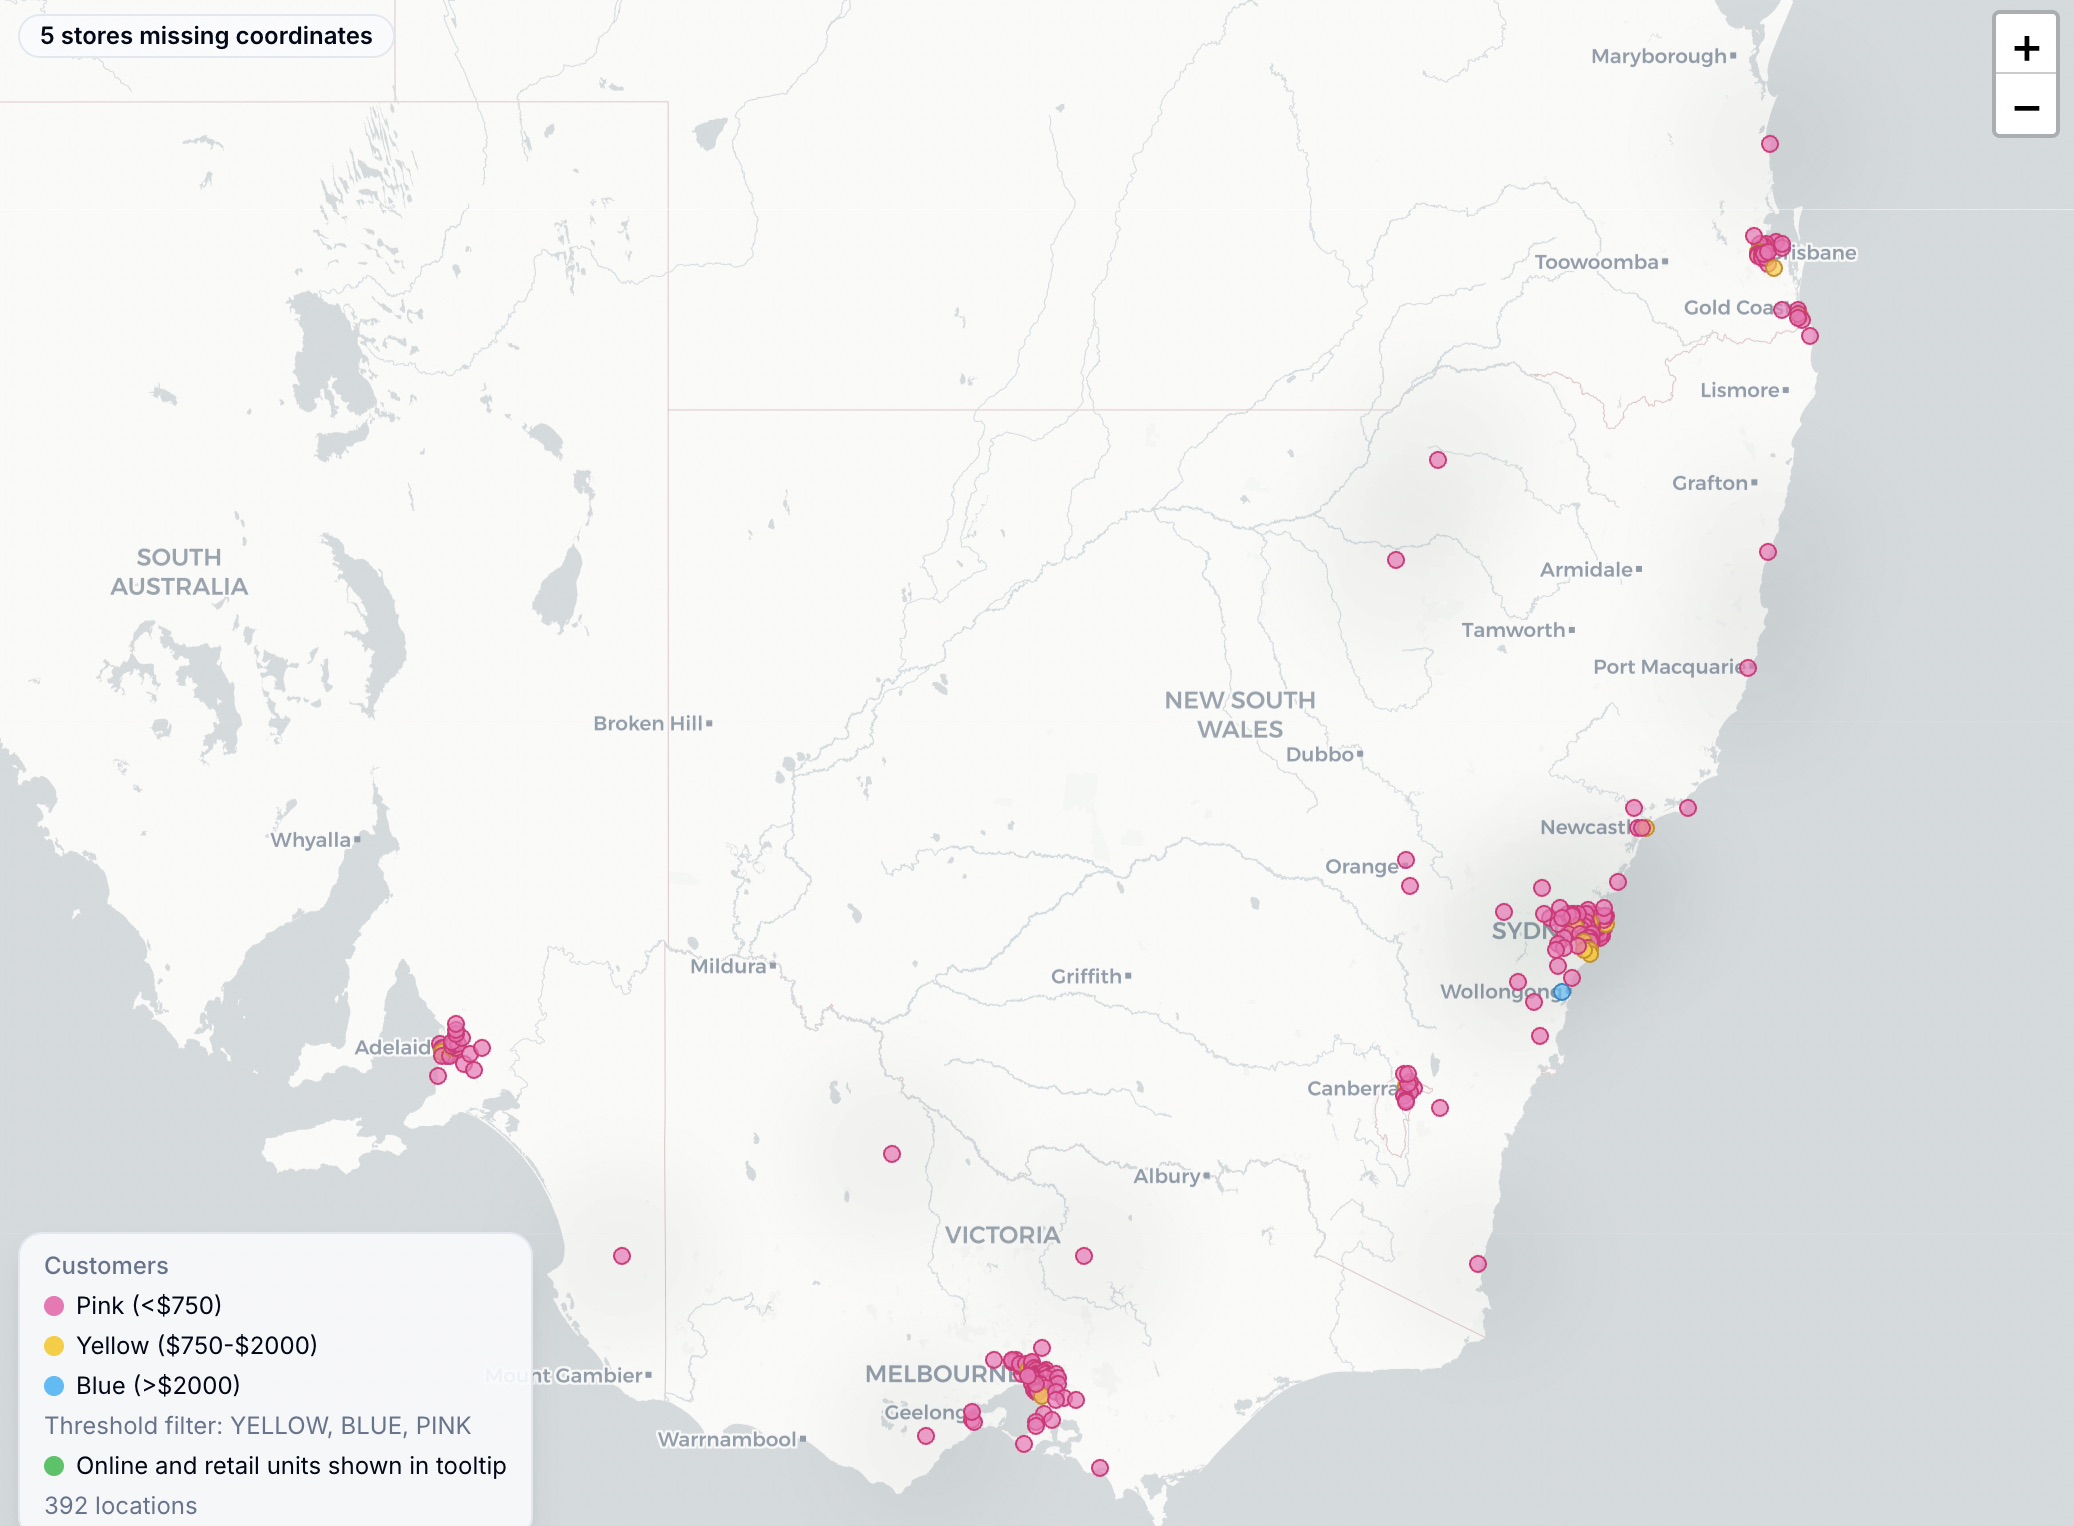
Interactive map showing customer locations colored by spend band or loyalty tier. Compare your physical network against where customers actually live and where online demand is already building.
- Three map modes: stores, online reach, and customer intelligence
- Spend bands (<$750 / $750-2K / >$2K) and loyalty tiers (Silver/Gold/Platinum)
- Opportunity scoring: density, spend, distance, online demand weighting
- Online vs. retail channel split by postcode
- Customer voice integration: themes and sentiment by geography
AI-assisted stock decisions across the store network. Validate store requests against stock on hand, warehouse availability, excess units in nearby stores, recent sell-through, freight logic, and size curves.
- Request validation with recent sales, stock-on-hand, and warehouse availability
- Smart transfer routing with donor-store excess and freight economics
- Size curve analysis: sales vs. stock distribution with buy recommendations
- Three policy presets (Balanced / Conservative / Aggressive)
- Fragmentation tracking and consolidation recommendations
A marketing image workspace for source photos, prompt-based campaign edits and recent outputs. It is built for retail teams who need polished campaign assets without losing product detail.
- Upload photoshoot source images and generate campaign variants
- Source-preserving prompt flow for identity, outfit and product details
- Portrait, landscape, square and auto aspect options
- Quality controls for high, medium, low or automatic generation
- Recent outputs library for reviewing and opening final assets
Source image
Source-preserving generation
Create a winter campaign image for the navy overcoat.
Identity
Outfit
Details
Recent outputs saved to library
When AI surfaces a priority insight, Campora AI turns it into a tracked task that is assigned to the right person, due on the right date, and visible in the next reporting cycle.
- Auto-created from AI insights, store visits, and manager replies
- Kanban board with drag-and-drop status (To Do → In Progress → Completed)
- Assigned to individual staff or entire stores with email notification
- Priority levels (High / Medium / Low) with business section tagging
- Photo evidence and comments tracked to completion with audit trail
Insight to action workflow
Full workspace
The pages work together, not as disconnected tools.
Campora is strongest when every page feeds the same operating loop: teams report what happened, leaders investigate why, and actions are tracked back through the next reporting cycle.
Dashboards
Daily and weekly KPI views with LY movement, budget variance, traffic, ATV, IPT, conversion, and trend exploration.
Ask AI
Ask about stores, products, departments, categories, reports, dates, floorplans, stock gaps, or weekly performance and get evidence-backed answers.
Inbox & Briefings
Published briefings, workbook attachments, weekly store summaries, and source-linked evidence live in one place.
Reporting Automation
Manual and scheduled KPI, online, money mapping, category, heat map, store summary, and AI reports with run history.
EOD & Store Visits
Templates, question banks, scored audits, compliance, coverage, leaderboards, manager replies, and follow-up workflows.
Money Mapping
Floorplan heatmaps, barcode scanning, section budgets, off-floor reconciliation, benchmarks, and version comparisons.
Products
Product cards, size curves, sell-through, weeks cover, floor placement, and buy/transfer recommendations.
Range & Buy Engine
Scenario planning, workbook upload, buyer rules, evidence, recommendations, approvals, and export packs.
Staff Insights
Sales/hour leaderboards, ATV, IPT, category strengths, coaching gaps, and salesperson drilldowns.
Storefront Assistant
Customer tap-to-ask experience for product discovery, sale items, price filters, and floorplan locations.
Marketing Studio
Source-preserving campaign image generation with uploaded assets, prompt controls, and recent output history.
Team Management
Role-based access, store assignments, report recipients, and visibility controls for store and field teams.
Tasks
AI insights, visits, and manager replies become assigned tasks with owners, due dates, evidence, and completion tracking.
Deeper Pages
Focused pages for the workflows retailers usually search for next.
If you are evaluating software by workflow rather than by vendor name, these pages go deeper on reporting, audits, floorplan analytics, stock decisions, and rollout sequencing.